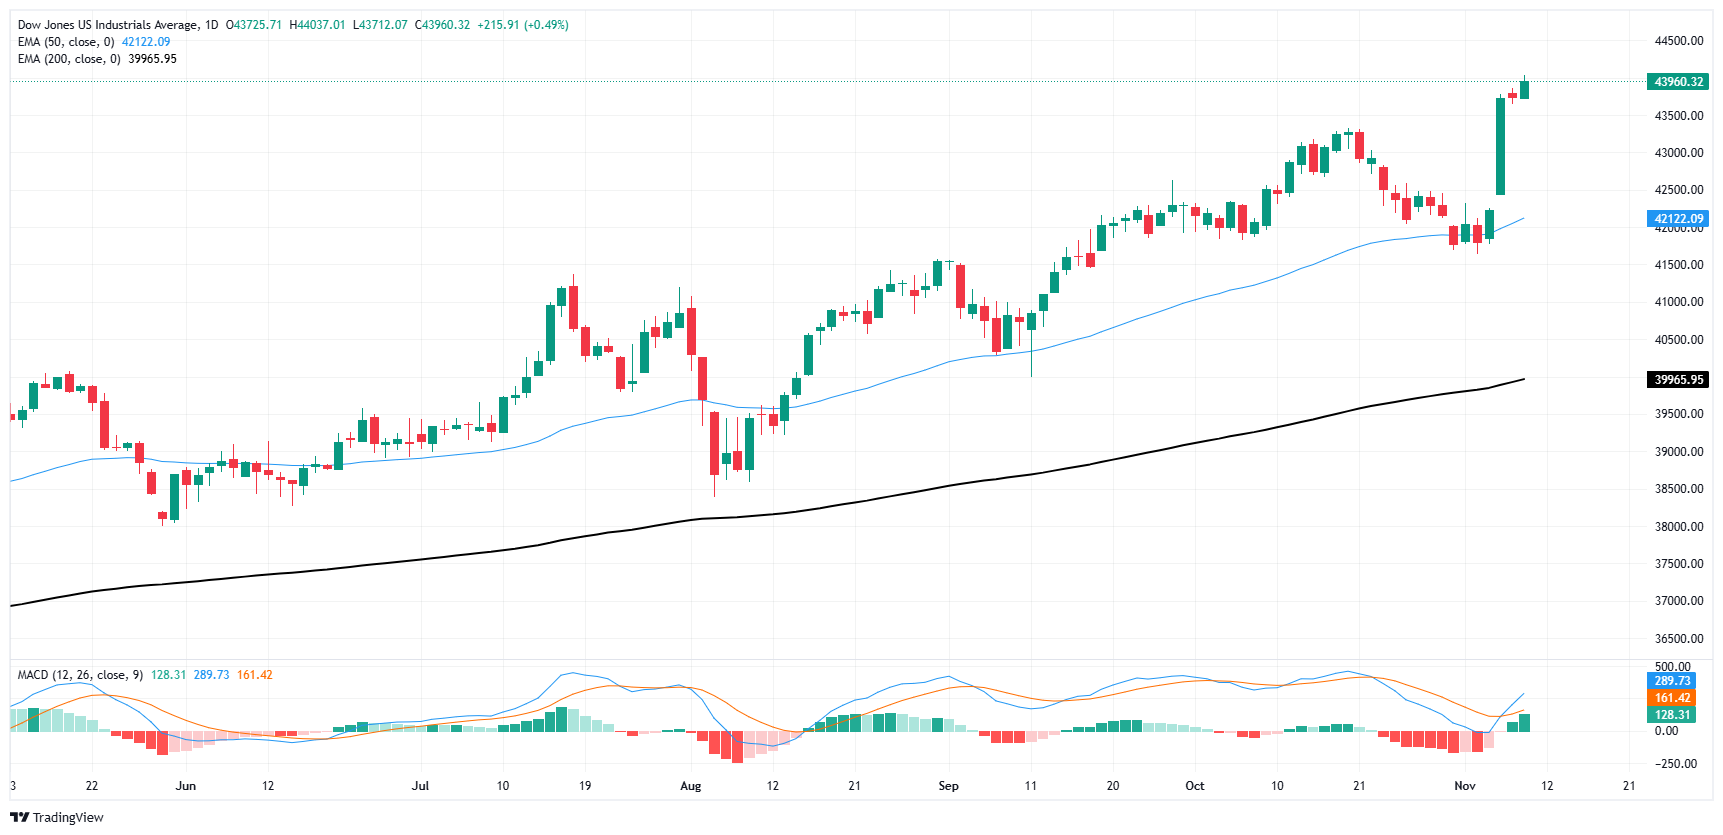
- Dow Jones tapped 44,000 for the first time ever on Friday.
- Equities are extending a near-term bullish push to wrap up the trading week.
- UoM sentiment survey results came in much better than expected.
The Dow Jones Industrial Average (DJIA) rose into fresh all-time highs on Friday, clipping into 44,000 as stocks lean firmly bullish to close out a record week. The Dow had its best week since October of 2023, rising nearly 5% and piercing record bids three days in a row.
The University of Michigan (UoM) Consumer Sentiment Index rose to 73.0 in November, overshooting the expected print of 71.0 and climbing further above October’s 70.5 as polled consumers tilt cautiously optimistic regarding the everall state of the US economy. On the downside, 5-year Consumer Inflation Expectations also ticked higher once again, rising to 3.1% compared to the previous print of 3.0%.
A decisive election win for former President Donald Trump helped to send stocks soaring this week, and a follow-up 25 bps interest rate trim from the Federal Reserve (Fed) kept the gas pedal pinned to the floor. Friday’s uptick in consumer outlook survey results only keeps stock traders leaning into the buy button.
Dow Jones news
Over two-thirds of the Dow Jones index found room on the high end on Friday, with most equities ending the week higher than they started. McDonald’s (MCD), Unitedhealth (UNH), and Procter & Gamble (PG) all ended Friday up around 2%, with MCD breaking above $300 per share for the first time in several weeks.
On the low end, Caterpillar (CAT) backslide around 3.5%, falling below $395 per share and extending its earnings miss decline after the company’s revenue fell 4% YoY. According to a statement from Caterpillar, the decline was a result of “lower sales of equipment to end users”, adding on that “changes in dealer inventories had an unfavourable impact to sales volume.”
Dow Jones price forecast
With the Dow Jones holding stubbornly in record high territory, a technical case for short momentum appears frustratingly impossible. By all measures, the DJIA is pinned far too deep into overbought territory to consider a fresh bid, but continued topside momentum has left the chart entirely absent any technical short entry points.
“Winners keep winning” is the approach to a long-run Dow Jones bullish trend. The major equity index has entirely outpaced its own 200-day Exponential Moving Average (EMA) for an entire year. Despite a brief reprieve in October, the Dow Jones has continued its one-sided bullish tilt, closing in the green for all but two of the last 11 consecutive months and on pace to chalk in another gain month in November as long as bidders maintain their balance.
Dow Jones daily chart
Economic Indicator
Michigan Consumer Sentiment Index
The Michigan Consumer Sentiment Index, released on a monthly basis by the University of Michigan, is a survey gauging sentiment among consumers in the United States. The questions cover three broad areas: personal finances, business conditions and buying conditions. The data shows a picture of whether or not consumers are willing to spend money, a key factor as consumer spending is a major driver of the US economy. The University of Michigan survey has proven to be an accurate indicator of the future course of the US economy. The survey publishes a preliminary, mid-month reading and a final print at the end of the month. Generally, a high reading is bullish for the US Dollar (USD), while a low reading is bearish.
Last release: Fri Nov 08, 2024 15:00 (Prel)
Frequency: Monthly
Actual: 73
Consensus: 71
Previous: 70.5
Source: University of Michigan
Consumer exuberance can translate into greater spending and faster economic growth, implying a stronger labor market and a potential pick-up in inflation, helping turn the Fed hawkish. This survey’s popularity among analysts (mentioned more frequently than CB Consumer Confidence) is justified because the data here includes interviews conducted up to a day or two before the official release, making it a timely measure of consumer mood, but foremost because it gauges consumer attitudes on financial and income situations. Actual figures beating consensus tend to be USD bullish.
Information on these pages contains forward-looking statements that involve risks and uncertainties. Markets and instruments profiled on this page are for informational purposes only and should not in any way come across as a recommendation to buy or sell in these assets. You should do your own thorough research before making any investment decisions. FXStreet does not in any way guarantee that this information is free from mistakes, errors, or material misstatements. It also does not guarantee that this information is of a timely nature. Investing in Open Markets involves a great deal of risk, including the loss of all or a portion of your investment, as well as emotional distress. All risks, losses and costs associated with investing, including total loss of principal, are your responsibility. The views and opinions expressed in this article are those of the authors and do not necessarily reflect the official policy or position of FXStreet nor its advertisers. The author will not be held responsible for information that is found at the end of links posted on this page.
If not otherwise explicitly mentioned in the body of the article, at the time of writing, the author has no position in any stock mentioned in this article and no business relationship with any company mentioned. The author has not received compensation for writing this article, other than from FXStreet.
FXStreet and the author do not provide personalized recommendations. The author makes no representations as to the accuracy, completeness, or suitability of this information. FXStreet and the author will not be liable for any errors, omissions or any losses, injuries or damages arising from this information and its display or use. Errors and omissions excepted.
The author and FXStreet are not registered investment advisors and nothing in this article is intended to be investment advice.


