- Amazon stock closes 2.94% higher at new all-time high.
- November NFP hits well above expectations on Friday.
- Amazon is still seeing positive vibes from its new AI chip.
- Amazon shares have risen in eight of last nine sessions.
Amazon (AMZN) stock is up for the sixth consecutive session on Friday, a streak that began on November 29. What’s more, AMZN stock has advanced in eight out of the last nine sessions. Since then the world’s largest ecommerce platform has gained 14.1% or nearly $300 billion in market cap.
At the close, Amazon stock advanced 2.94% to $227.03, closing on Friday near the daily high and also new all-time high.
The Dow Jones Industrial Average (DJIA), which includes Amazon among its 30 constituents, traded slightly lower due to the continuing sell-off of UnitedHealth Group (UNH) following the Wednesday slaying of one of its top executives. UNH stock fell as much as 5% earlier in the session, while much of the market got excited over the November Nonfarm Payrolls figure hitting 227K, well above the consensus expectation. The DJIA closed down 0.28%.
Amazon stock news
Amazon’s price rally does not appear to be based on any one thing. AMZN stock has been in an uptrend since at least August 5, about four months ago, and over the longer term since December 2022.
The recent news last week that Amazon has built the second version of a new AI-inflected data center chip is a bright spot. The Trainium2 processor was developed in-house from Annapurna Labs and is said to be four times faster than its earlier iteration.
On Wednesday, Apple (AAPL) said that it expects up to 50% efficiency gains by using the Trainium2 chip to train some of its AI models. It has also been using AWS’ Inferentia and Graviton chips for its search widgets.
Amazon Web Services has also announced new partnerships with PagerDuty (PD) and GitLab (GTLB) to train AI products.
Additionally, Black Friday and Cyber Monday sales are showing that the US consumer is spending at a healthy clip during the holiday season. Adobe Analytics estimated that consumers spent $13.3 billion on Cyber Monday earlier this week. That was 7.3% higher than 2023.
Black Friday sales topped $10.8 billion as well, and Amazon was sure to be a major recipient of that spend.
On Wednesday it came to light that JPMorgan (JPM) and AT&T (T) have halted their advertising on Amazon’s Twitch streaming platform due to complaints alleging that the site is promoting “antisemitic” content.
Amazon stock chart
Amazon stock is looking like the healthiest of the Magnificent 7 coming down the home stretch of 2024. Shares are up 49% year to date, while Nvidia (NVDA) has continued to tread water since its earnings release.
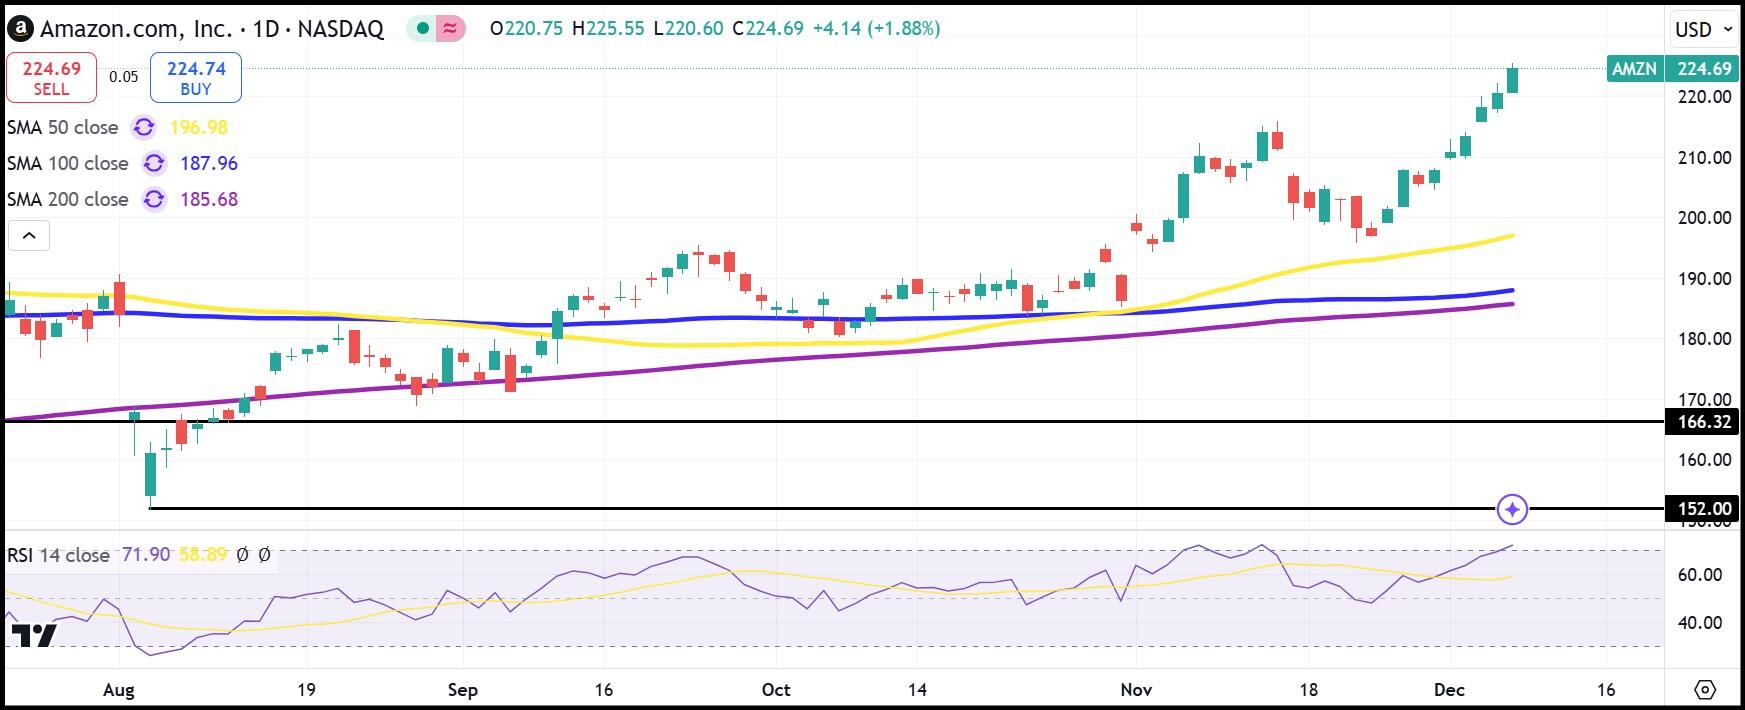
Support rests in the vicinity of $196 or $197, where the 50-day Simple Moving Average (SMA) coincides with the pullback on November 20th and 21st.
After seeing so many up days, it would be likely for consolidation to ensue. However, the Relative Strength Index (RSI) is only at 73, just barely in overbought territory. Any pullback might not get further than the prior range high in November near $215.
AMZN daily stock chart
Information on these pages contains forward-looking statements that involve risks and uncertainties. Markets and instruments profiled on this page are for informational purposes only and should not in any way come across as a recommendation to buy or sell in these assets. You should do your own thorough research before making any investment decisions. FXStreet does not in any way guarantee that this information is free from mistakes, errors, or material misstatements. It also does not guarantee that this information is of a timely nature. Investing in Open Markets involves a great deal of risk, including the loss of all or a portion of your investment, as well as emotional distress. All risks, losses and costs associated with investing, including total loss of principal, are your responsibility. The views and opinions expressed in this article are those of the authors and do not necessarily reflect the official policy or position of FXStreet nor its advertisers. The author will not be held responsible for information that is found at the end of links posted on this page.
If not otherwise explicitly mentioned in the body of the article, at the time of writing, the author has no position in any stock mentioned in this article and no business relationship with any company mentioned. The author has not received compensation for writing this article, other than from FXStreet.
FXStreet and the author do not provide personalized recommendations. The author makes no representations as to the accuracy, completeness, or suitability of this information. FXStreet and the author will not be liable for any errors, omissions or any losses, injuries or damages arising from this information and its display or use. Errors and omissions excepted.
The author and FXStreet are not registered investment advisors and nothing in this article is intended to be investment advice.


